Why Chemical Resistance Charts Don’t Tell the Whole Story
Why Chemical Resistance Charts Don’t Tell the Whole Story
 Many people like to be in control. This basic principle of human nature extends into many aspects of daily life, not the least of which is work. When I was working as an engineer for a chemical company, often I would start figuring out what products to use for a particular application by studying suppliers’ literature. If I could find enough documentation to support a certain choice, I would feel confident writing a specification without further consultation with the supplier. This approach was efficient and gave me a sense of control over the design process.
Unfortunately, this approach didn’t tap into the considerable technical knowledge the vendors have about their products and the applications for which they were developed, knowledge which might have lead me to make an even better choice. In the interests of expediency and control, I probably missed many great opportunities to “wow” my peers with my insightful design choices and maybe even get nominated for a few more of those coveted design excellence awards. Sigh. With years of experience working for a material supplier under my belt, and hindsight being 20-20, I have gained an appreciation for the complexity of even some common applications.
Consider the ubiquitous chemical resistance chart. Corrosion resistant material suppliers often publish chemical resistance charts that list individual chemicals and their products’ resistance to them. Some of these charts do not take into consideration the temperature of the chemical, or they provide data for a given temperature. Often 70°F is referenced. Some charts indicate resistance according to the anticipated degree of chemical exposure, e.g. continuous immersion, 72-hour immersion, or splash-and-spill.
Aside from the lack of information regarding variations in chemical-resistance with respect to temperature, there are other inherent limitations to the typical chemical resistance chart:
- No detailed ratings for mixtures of chemicals
- No service life expectations
- No data regarding the effect the lining material could have on the chemicals to which it will be exposed.
This article will discuss those first two limitations. We’ll have to leave that third one for another time.
Secondary containment linings are primarily designed to protect the containment structure against corrosion during a spill event until the spill can be cleaned up. This period is typically 72 hours. Perhaps the advantage in making the best possible lining choice is not as significant in this kind of application as it is in a piece of process equipment. Process equipment maintenance and repair usually have to happen during production outages, and if the plant is not running, it is not making money. This is where making the best possible lining material choices really start to payoff.
The following example illustrates how a specifier could be led to choose different chemical-resistant mortars for their brick- or tile-lined equipment based on two sources of information: a mortar supplier’s product literature and laboratory data developed for the specifier by the same mortar supplier. Presented below are three graphs, which compare temperature resistance data and compressive strength retention data for three different vinyl ester mortar formulations. Mortar A, Mortar B, and Mortar C are the same, respectively, in each chart. The compressive strength retention tests were conducted under two slightly different process conditions: acidic-oxidizing conditions at 203°F and alkaline-oxidizing conditions at 160°F.
Figure 1 – Service Temperature Limitations of Three Vinyl Ester Mortars
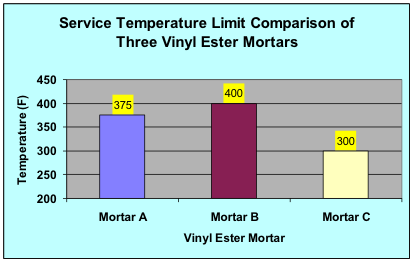
Figure 1 shows the temperature resistance of three different vinyl ester mortars. Reading the mortar manufacturer’s chemical resistance charts and product data sheets, the specifier finds each of the chemicals in her process tank is resistant to Mortar B. She sees that Mortar B has the highest temperature rating and chooses to specify Mortar B. It is the most expensive mortar, but it appears to be the best.
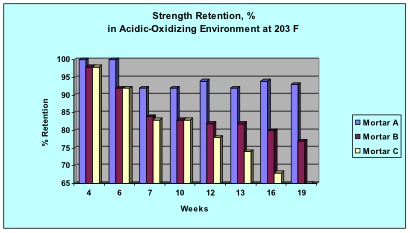
The specifier, confident in her choice of Mortar B, calls the mortar supplier for reassurance that she has made the right choice. After reviewing the application, an acidic-oxidizing process operating at 203°F, the mortar supplier offers to test the combination of chemicals at the specific operating temperature and measure strength retention over time. The data in Figure 2 is presented, and the specifier is convinced that in fact Mortar A is the best choice. As it turns out, Mortar A is less expensive than Mortar B, and it should be expected to last longer than Mortar B in this application.
Figure 2 – Comparison of Vinyl Ester Mortar Strength Retention in Acidic-Oxidizing Environment at 203°F
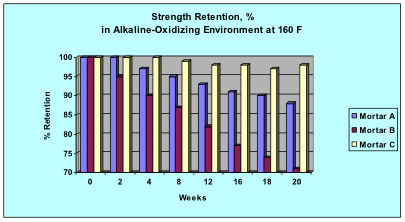
Later on, the process engineer is designing a different tank, which will operate at a cooler temperature than the first tank. Both applications involved oxidizing chemistry, and since the temperature in the second application is not as high, she again chooses Mortar A. Once again, she calls the mortar supplier for reassurance that she has made the right choice, and, once again, the mortar supplier offers to test the proposed chemical mix at the anticipated operating temperature. This time, the chemistry is alkaline-oxidizing at 160°F. The data in Figure 3 is presented, and the specifier’s preliminary mortar choice is again overturned. She clearly must choose Mortar C. Much to her pleasure, Mortar C is less expensive than Mortar A, and it can be expected to last longer than Mortar A in this application.
Figure 3 – Comparison of Vinyl Ester Mortar Strength Retention in Alkaline-Oxidizing Environment at 160°F
The moral of this story is that chemical resistance charts don’t tell the whole story. When there is a lot of money at stake—and when isn’t there?—it pays to make the best possible design decisions. When choosing materials for corrosion-resistant construction, material suppliers can provide invaluable guidance and technical support. It’s just not practical to capture every conceivable mixture of chemicals and temperatures in a chemical resistance chart, and differentiate the service life of each “recommended” material option. While a chart is a useful tool to get you pointed in the right direction, the best solutions are identified through consultation, and sometimes research and development partnership, with corrosion-resistant material suppliers.